
Software Based Wow and Flutter Analysis
While building my DIY turntable I became interested in measuring its performance. I first came across the idea of software bases wow and flutter analysis on Audiamorous.
This didn’t leave me with a lot to go on. So I began looking into software that could similar. I then found this thread on Pink Fish Media.
From there, I developed this technique:
Software Needed:
Hardware:
A test LP with a 3150hz test signal, like this one from Analogue Productions.
A method of recording this into a computer.
Part 1: Recording
Record the track into Audacity, Split the track to mono, discard one channel. Use effects>normalise and set to -15db and remove dc offset. Use Analyze>plot spectrum with enough points to find the the frequency of the track, make a note of it. Export the track with a name like Turntable3150.wav, use whatever the frequency you found in the spectrum. If the result isn’t clear enough in Audacity, use Rightmark, It allows you to zoom right in on the Spectrum.
Part 2: Demodulation.
Open up Spectrum lab. Go to components>show components. Set up the FM Demodulator on the second dsp filter like this:

Spectrum Lab Component Settings
Be sure to set the Center Frequency to that of the file.
Click on the triangle (the output amplifier) to the right of the dsp settings, and set the Gain to -25db. I have found this setting to work for all but the most out of spec recordings. Edit: I have found in the latest version a setting of +70db to be optimal.
Go to file>audio files and streams>save output in audiofile. Save the file as something like Turntable-WF.wav.
Now go to file>audio files and streams>analyse and play file (with dsp). Select your recording Turntable3150.wav.
Now you should, on the left see the Analyzer button reading through the track. Once it is paused and 100% through the track go to start stop> stop sound thread. The file>audio files and streams> stop logging to file. I often keep spectrum lab open at this point as it is quicker to re-run any files.
Part 3: Analyzing the spectrum
Check the result in Audacity, it should look like this:

Wow and Flutter Signal In Audacity
Chop off the solid blue part and save. If you cant see the wave form, you might have demodulated at the wrong center frequency.
Now you can just load up the produced file into rightmark or any other program that gives detailed FFT results. Here is a sample from my Yamaha YP-D71:

Wow and Flutter Spectrum from Yamaha YP-D71
This gives us the frequency of of any speed modulations. In this case the most prominent spike is 9hz.
Part 4: Polar plotting the result.
From the Pink fish media thread, Paul R had the great idea of plotting the wow and flutter signal as a polar plot, allowing you to see the speed variance as it occurs over the revolution of the platter.
First, load the Turntable-wf.wav into audacity. Trim to get a 9 second sample of the wow and flutter signal. I then filter this signal to make the plot cleaner, I use a 12db low pass filter at 200hz, and a 12db high pass filter at 1hz. This will remove a lot of noise and reduce some of the variance due to the lp being off center.
Now, a polar plot in radians has 2pi per complete circle. To align the signal to this i just change the rate, go to the track click on its drop down menu>set rate>other.
Now for some maths, to set the rate I use (1.8/(2*pi))*44100, Where 1.8 is the time for one revolution, and 44100 is the sample rate of the recording. If your turntable deviated considerably from 3150hz you can use (3150/measured frequency)*1.8 to get the actual time per revolution. In this case I set the rate to 12634. This will extend the wav form in the window.
Now export to something like turrntable-wf-9.wav.
We need to convert this with sox to a data file gnuplot will read. use the command:
sox turntable-wf-9.wav turntablepolar.dat.
I keep the sound files in the sox directory to make life easy.
Load up gnu plot and use:
gnuplot> set polar
gnuplot> set terminal win
gnuplot> set size square
gnuplot> set rrange [-4:2]
gnuplot> set datafile commentschars “;”
gnuplot> plot ‘C:\sox\turntablepolar.dat’ every 150:150 with lines
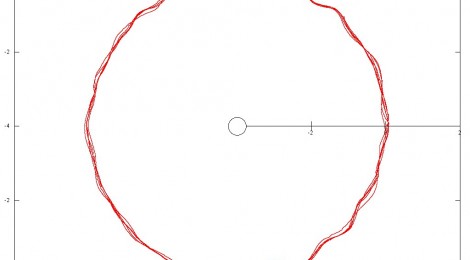
This will produce a plot along the lines of this:

Yamaha YP-D1 Wow and Flutter signal Polar Plot
In this case most of the wobbles at 9hz are a warp in the test lp. I will leave discussion of the results to other places this is realy just a how too. Any questions be sure to ask in the comments.
Very interesting – thank you for writing this up.
Thanks.
Thank you for a very interesting work. However, I can not get get the Spectrum Lab configured as per your above requirement – any help appreciated.